People usually notice only badly designed craphics
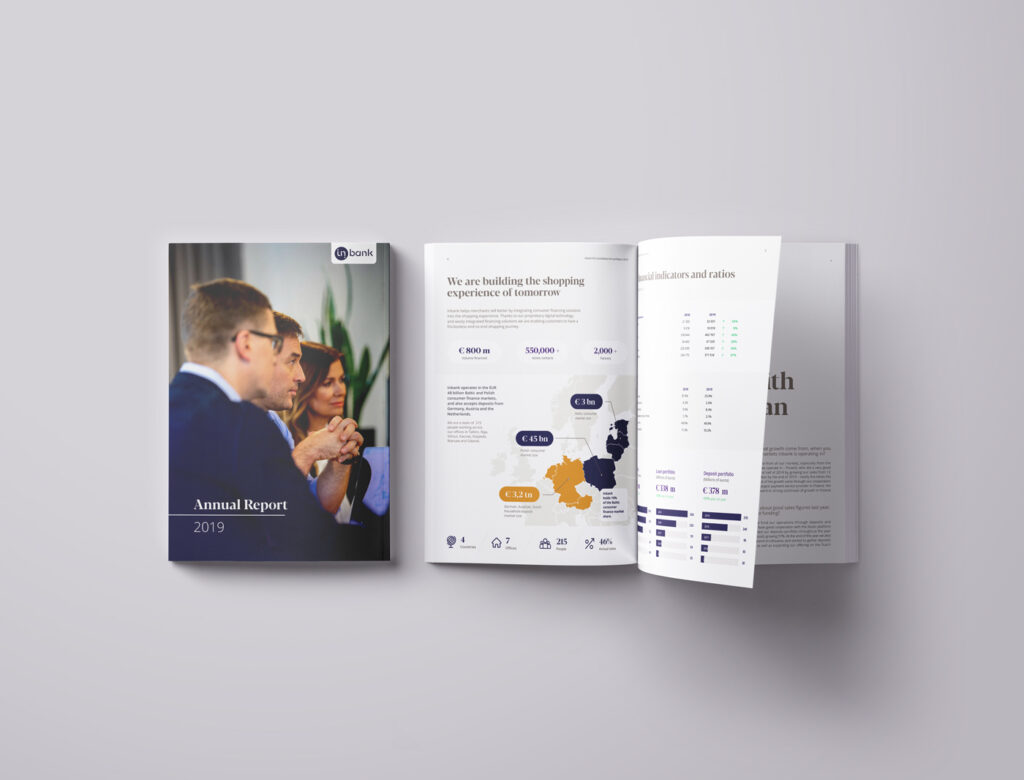
Data visualisation is a visual tool to provide data to a wider range of people. A good infographic is simple to read, attractive and fits with your brand guidelines.
We digest the information, make it simple, readable and easy to understand. We also create several annals, where presenting the data in a well packaged way is one of the key features.


